QGS/QPS Quantitative Cardiac SPECT Processing
As an authorized distributor of Cedars-Sinai cardiology medical group / Artificial Intelligence in Medicine (AIM) Cedars Cardiac Processing software, OVIS Imaging can add value and enhance your Nuclear Cardiac Imaging diagnostics. Customized
solutions can be tailored to incorporate general
nuclear imaging modalities and always support Dicom
PACS integration. Single or Multi-access configurations allow centralized processing while the Doctors read and interpret from their office computers locally or remotely.
Explore The Key Components
CSimport offers the following features:
Local database of images
Images are stored either in their native format or in a compressed proprietary format. As a new feature in version 3.0, conversion options are permanently established as import settings profiles to promote consistent import policies.
Multiple image import options
Images can be imported directly from a local disk (hard disk, CD, USB thumb drive, etc.) or a disk mapped from a remote host. Images can also be imported from remote
Philips Pegasys or Odyssey systems, FTP servers, and DICOM Query/Retrieve servers such as Picture Archiving and Communication Systems (PACS). Version 3.0 introduces DICOM query filters, providing a more efficient method to
query.
A separate DICOM Store Service Class Provider (SCP) service is installed that allows images to be pushed from DICOM-compliant remote systems. CSimport provides service management and configuration options.
Flexible data management
Starting with version 3.0, CSimport allows the user to maintain an arbitrary hierarchy of folders to store the data, as opposed to the fixed two-level patient/datasets hierarchy of previous versions. This means, for instance, that a
user can create a folder for teaching cases with subfolders for specific pathologies and copy or move studies in the appropriate folder. Folders and datasets can also be flagged with a color, with tags, and with extended comments,
all of which can be searched for across the entire image database (in addition to folder/patient name, MRN, study description, etc.) The current folder view can also be filtered on-the-fly by using a filter bar at the top of the data
browser. Version 3.0 also introduces extended folder and dataset header editors.
QPS provides the following functionality:
- Automatic generation of left ventricle (LV) inner and outer surfaces and valve plane from LV short axis perfusion SPECT data, using user supplied hints if available (e.g. approximate LV location).
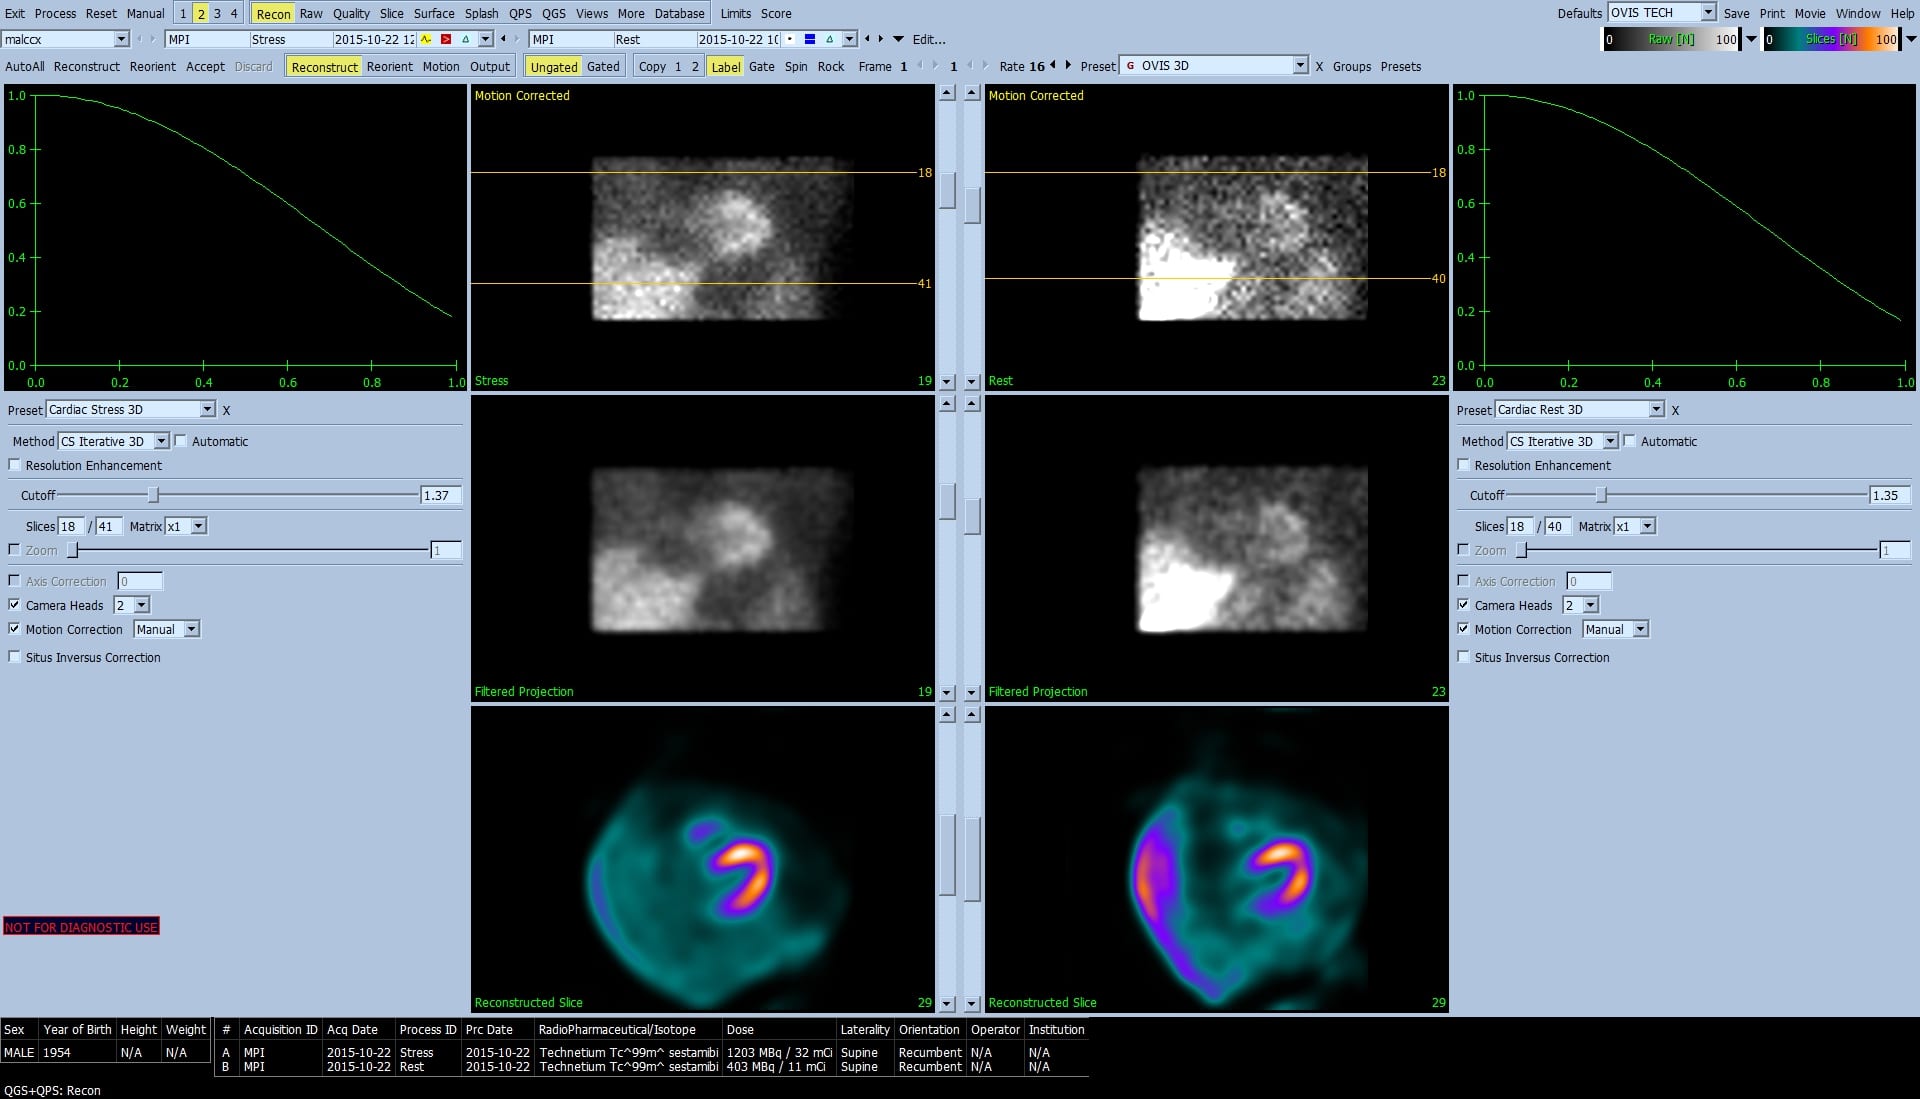
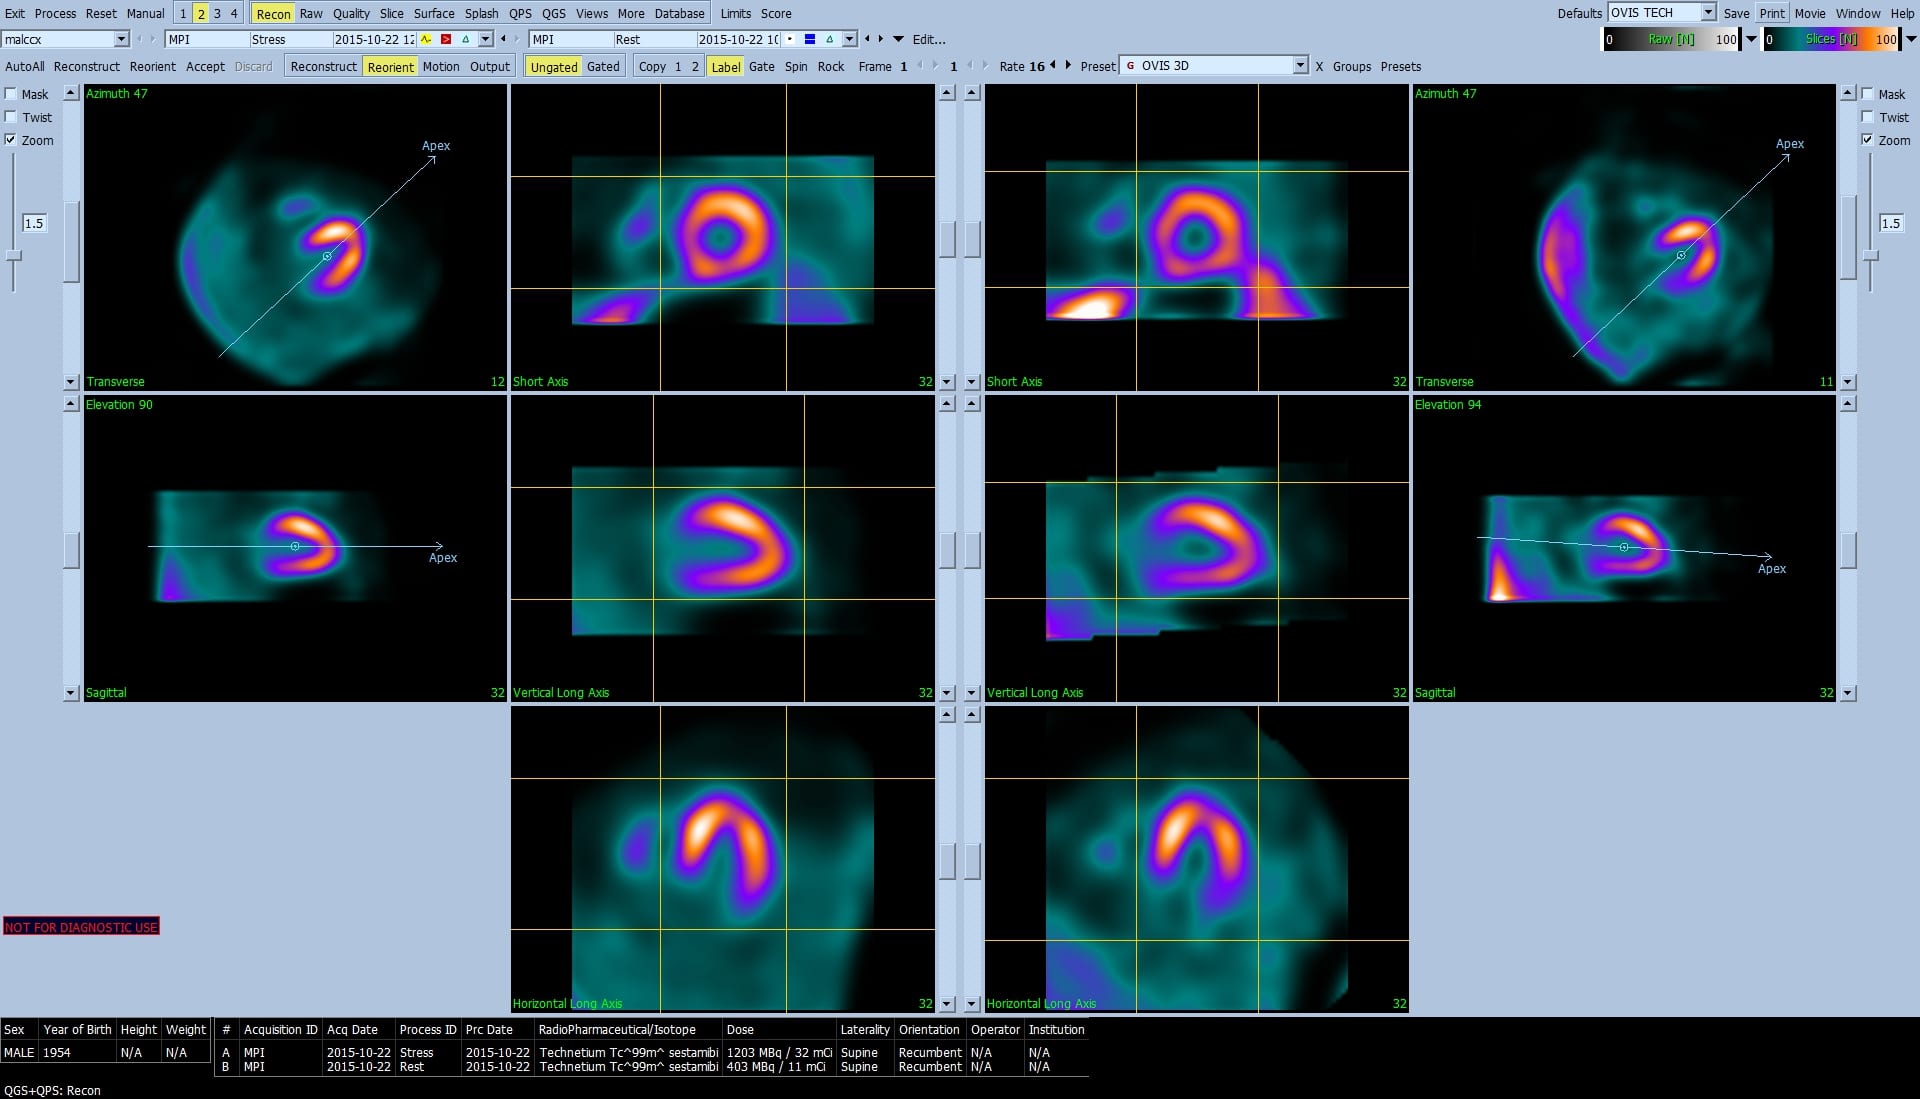
- Display of stress and rest projection (raw) images in static and cine mode. Two-dimensional display of stress and rest short axis SPECT images in 1 (single), 2 (dual), 3 (triple), or 4 (quadruple) mode. (2, 3, and 4 are displayed asinterleaved or side-by-side). Three-dimensional parametric display of stress and rest short axis SPECT images in 1 (single), 2 (dual), 3 (triple), or 4 (quadruple) mode. (2, 3, and 4 are displayed as interleaved or side-by-side).
- Automatic computation of functional metrics including LV chamber volume and mid-myocardial surface area
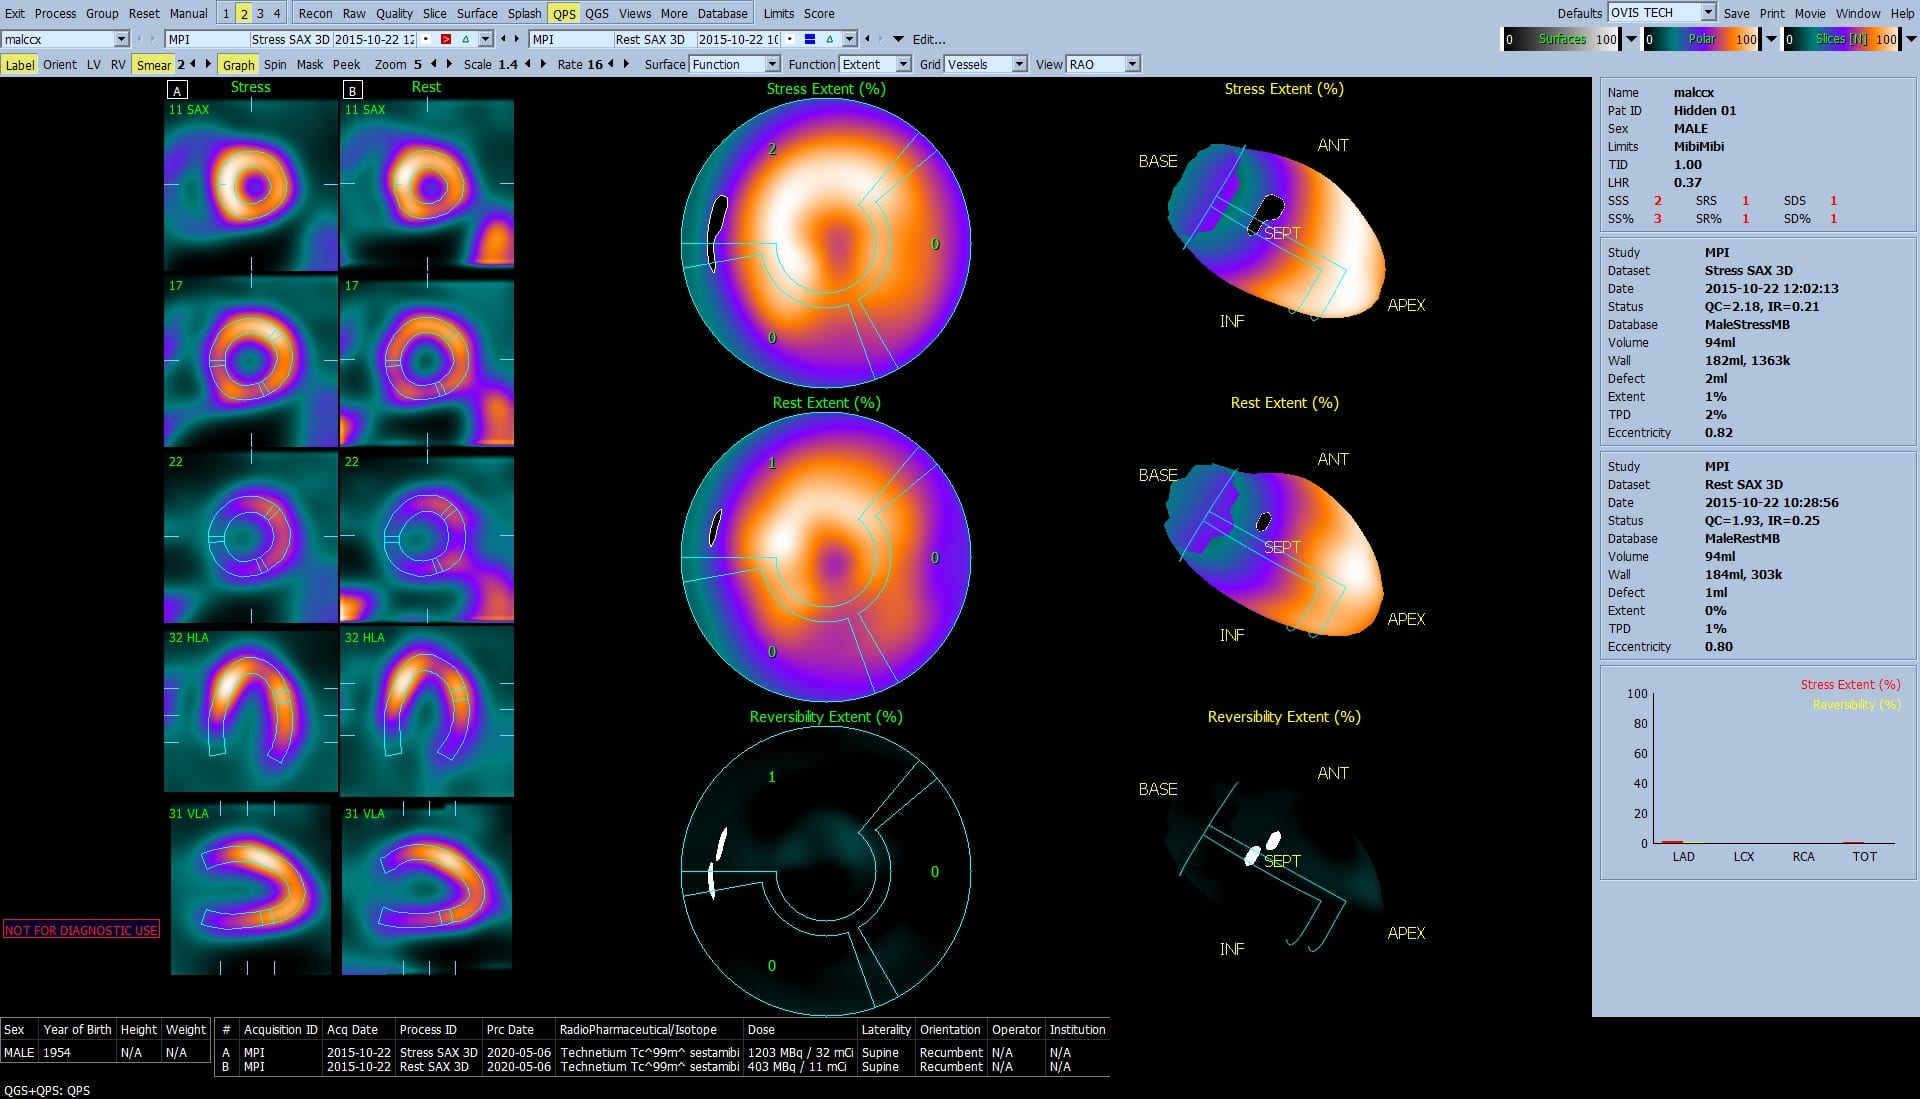
- Automatic generation of stress, rest and reversibility surfaces and polar maps, which display in parametric fashion the pattern of LV myocardial perfusion. Determination and display of the severity and extent of perfusion defects usingisotope- and gender-specific normal limits.
- Automatic computation of global quantitative defect size, both in absolute terms and as a percentage of the mid-myocardial surface area.
- Automatic generation of segmental perfusion scores (stress, rest and reversibility) based on a multi-segment, multiple-point scale, and subsequent derivation of the global scores SSS (summed stress score), SRS (summed rest score),SDS (summed difference score), SS% (summed stress percent), SR% (summed rest percent), and SD% (summed difference percent).
- Display of screen captures images (also known as snapshots).
- Storage of all generated results in a separate review file.
QGS provides the following functionality:
- Cedars QGS provides automatic generation of left ventricle (LV) inner and outer surfaces and valve plane from three- or four- dimensional (respectively static or gated) LV short axis perfusion SPECT data, using user-supplied hintsif available (e.g. approximate LV location).
- Display of projection (raw) images in static and cine mode. Two-dimensional display of gated short axis SPECT images in 1 (single), 2 (dual), 3 (triple), or 4 (quadruple) mode. (2, 3, and 4 are displayed as interleaved or side-by-side).Three-dimensional parametric display of gated short axis SPECT images in 1 (single), 2 (dual), 3 (triple), or 4 (quadruple) mode. (2, 3, and 4 are displayed as interleaved or side-by-side)
- Computation of functional metrics including LV volume/time curve, ED (end diastolic) volume, ES (end systolic) volume, SV (stroke volume), EF (ejection fraction), mid-myocardial surface area, SMS (summed motion score), STS (summedthickening score), SM% (summed motion percent), and ST% (summed thickening percent).
- Automatic generation of surfaces and polar maps, which display in parametric fashion the pattern of motion and thickening of the LV.
- Determination and display of the severity and extent of motion and thickening abnormalities using normal limits.
- Automatic generation of the segmental motion and thickening scores based on a multi-segment, multiple-point scale, and subsequent derivation of the global scores SMS (summed motion score), STS (summed thickening score), SM% (summedmotion percent), and ST% (summed thickening percent) from corresponding segmental scores.
- Display of screen captures and static projection datasets.
- Storage of all generated results in a separate review file.
- Interactive orthogonal slice displays in standard ACC format with optional overlaid LV surface contours and labeling
- Interactive LV surface rendered images with optional orientation tags and graphics
- Parametric surface and polar map display of motion and thickening by severity and extent
- Chamber volume versus interval plot
- Global statistics, including ED and ES chamber volume and ejection fraction
- Manual override of automatic LV segmentation
- Dual (side-by-side) dataset display


